
After flipping $124,000 into support, Bitcoin (CRYPTO: BTC) faces its biggest question yet: can ETF demand rewrite the script on past inflow tops?
Bitcoin Turns $124,000 Wall Into New Launchpad
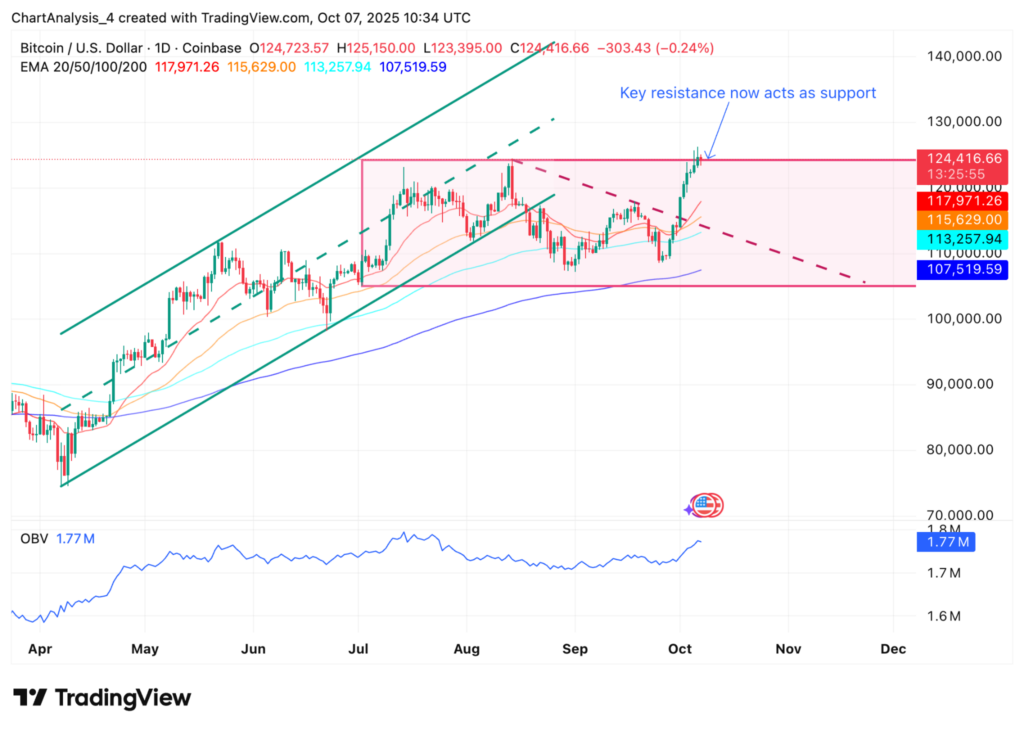
BTC New Support Level (Source: TradingView)
Technical Analysis: Bitcoin broke decisively above the $120,000–$124,000 ceiling, flipping a key resistance into support.
Daily candles now close above the 20, 50, and 100-day exponential moving averages, stacked between $113,000 and $118,000.
The 200-day EMA at $107,500 remains a long-term safeguard, but traders see the $124,000 level as the line that will decide whether momentum extends toward $145,000.
ETF Inflows Hit $1.2 Billion As Wall Street Piles In
ETF flows drove the move. Data from Sosovalue showed $1.2 billion in net inflows as reported on Monday, according to Bloomberg, with BlackRock’s iShares Bitcoin Trust (NASDAQ:IBIT) capturing $970 million.
That pushed IBIT close to $100 billion in assets under management, making it BlackRock’s most profitable ETF.
The scale highlights Wall Street’s growing role in bitcoin trading.
But history complicates the picture: previous $1 billion inflow days in March, November, and July each coincided with local tops.
On-Chain Data Splits Traders On Next Move
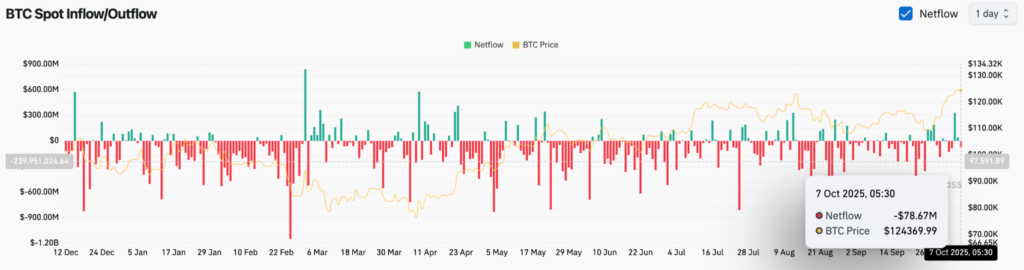
BTC Netflows (Source: Coinglass)
Exchange netflows for Oct. 7 showed a negative balance of about $78 million, according to Coinglass, suggesting holders are pulling coins off exchanges.
This is typically read as a vote of confidence in long-term storage.
However, the combination of heavy ETF buying with thinning exchange liquidity raises the possibility that price is being driven more by short-term speculation than broad organic demand.
Why It Matters
Bitcoin’s break above $124,000 is more than a clean resistance flip.
It coincides with ETF inflows pushing liquidity at the same time exchange balances fall, creating a technical setup where supply is vanishing as demand concentrates.
This alignment of thinning spot supply with record ETF accumulation has not appeared in previous cycles.
If price holds above the 20, 50, and 100-day EMA cluster while ETFs continue to absorb supply, it could signal a structural shift in how breakouts sustain.
Rather than a short-term rally, the market may be testing whether Bitcoin can establish $124,000 as the launchpad for the next major leg higher.
Read Next:
Image: Shutterstock


